
Analyze Scaled Bar Graphs Worksheets for 3rd Grade
Use a scaled bar graph to find how many more, how many fewer, and how many in all. 15 free printable worksheets, each with an answer key.
Save to PinterestFree Analyze Scaled Bar Graphs Worksheets
Click a worksheet to open the PDF, or grab the matching answer key. Every sheet prints on one page.
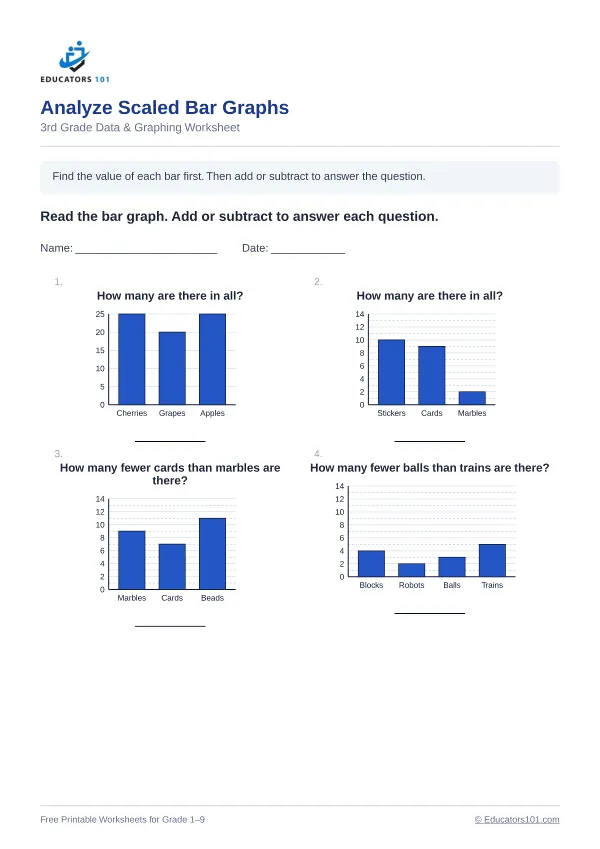 Worksheet #1
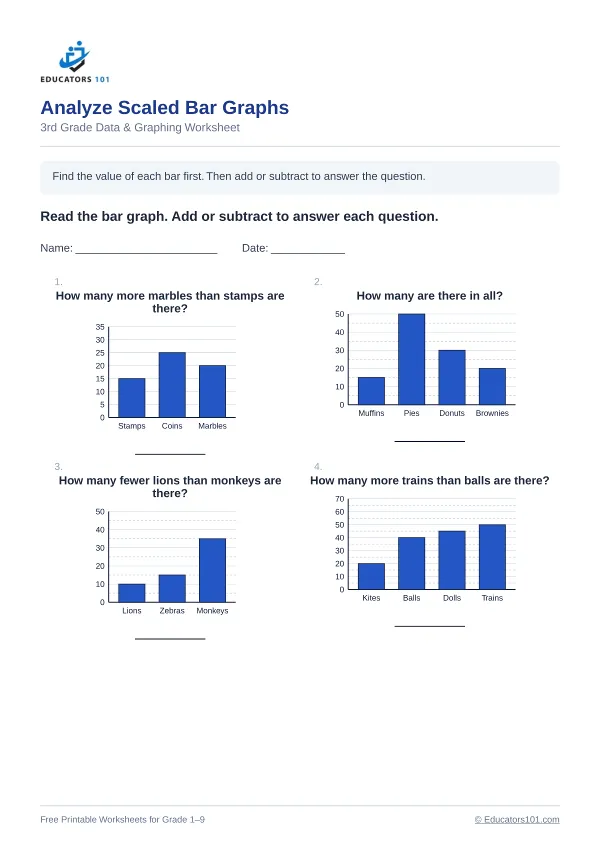 Worksheet #2
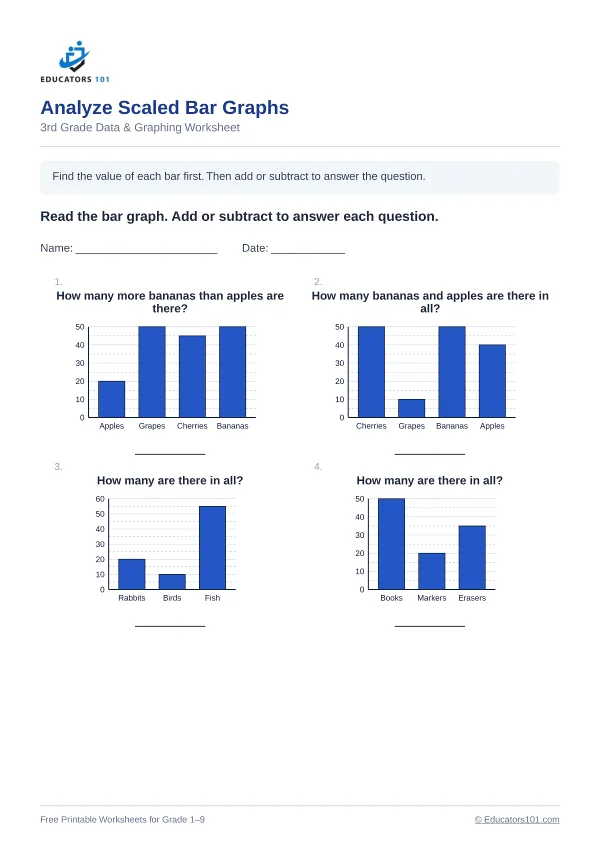 Worksheet #3
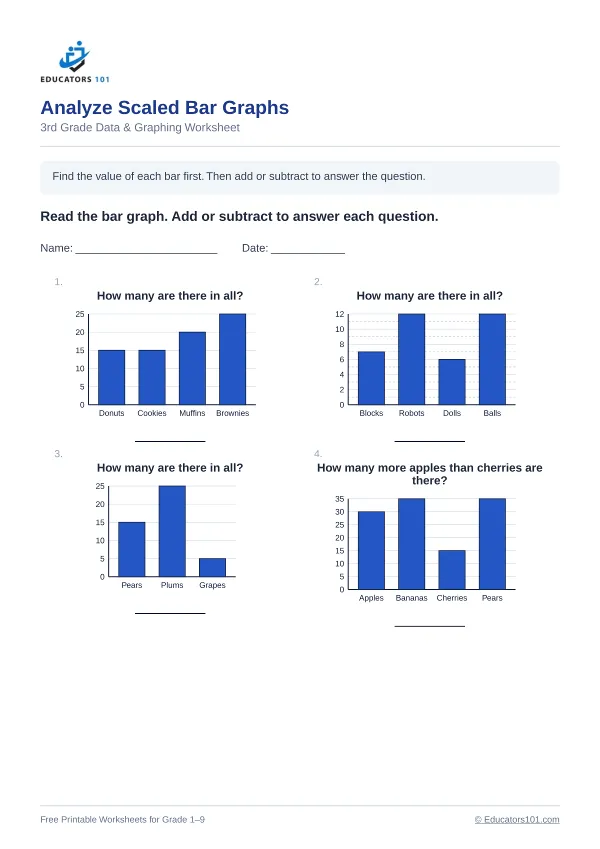 Worksheet #4
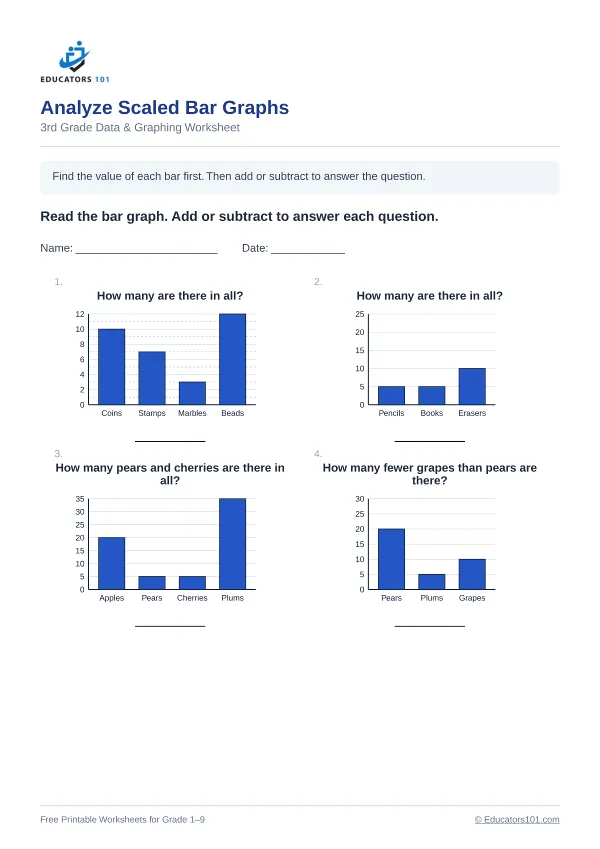 Worksheet #5
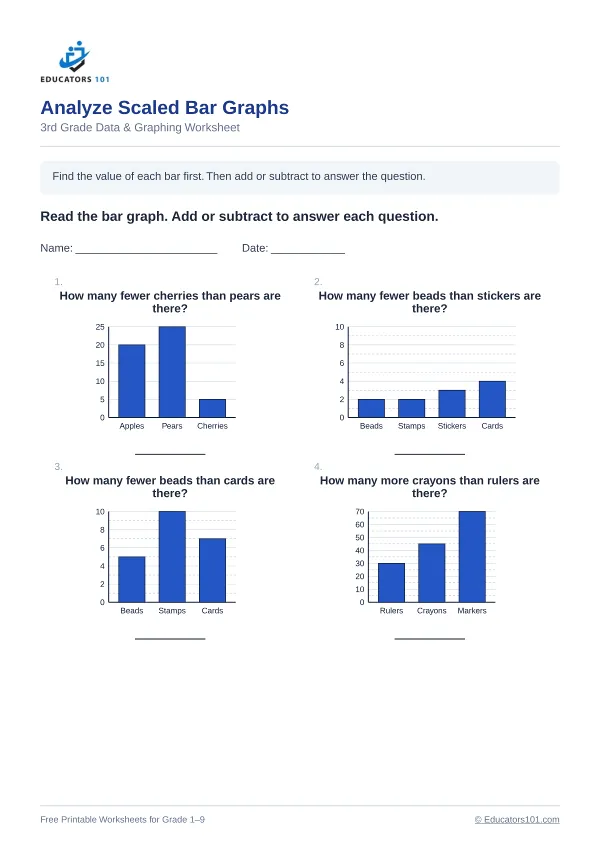 Worksheet #6
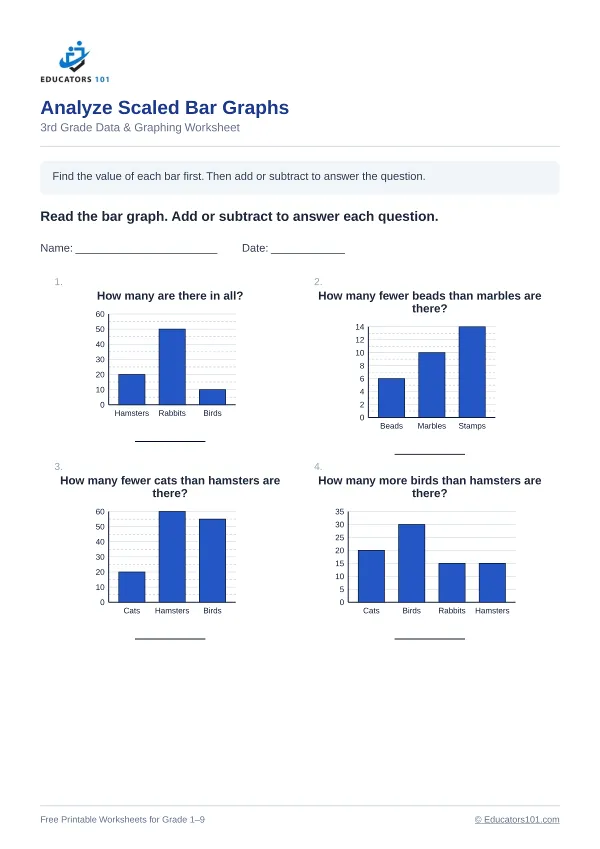 Worksheet #7
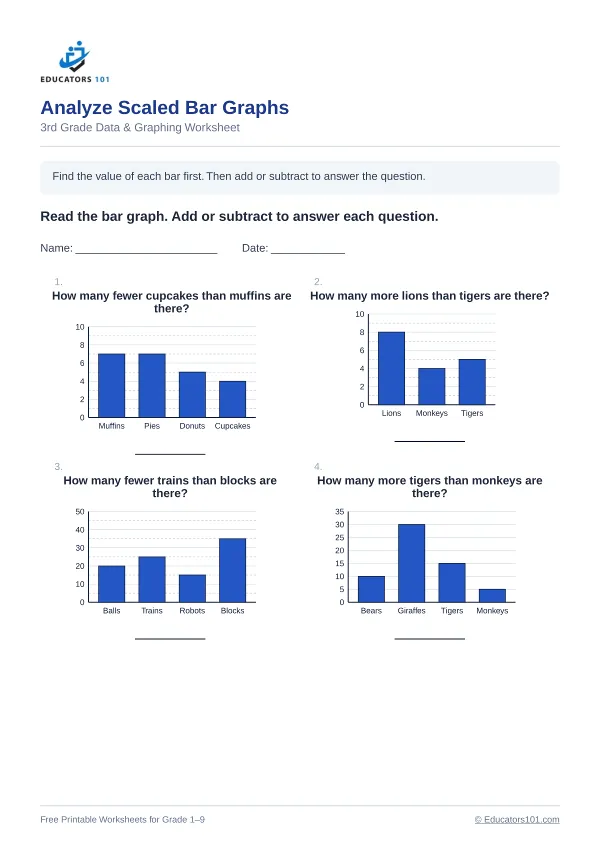 Worksheet #8
 Worksheet #9
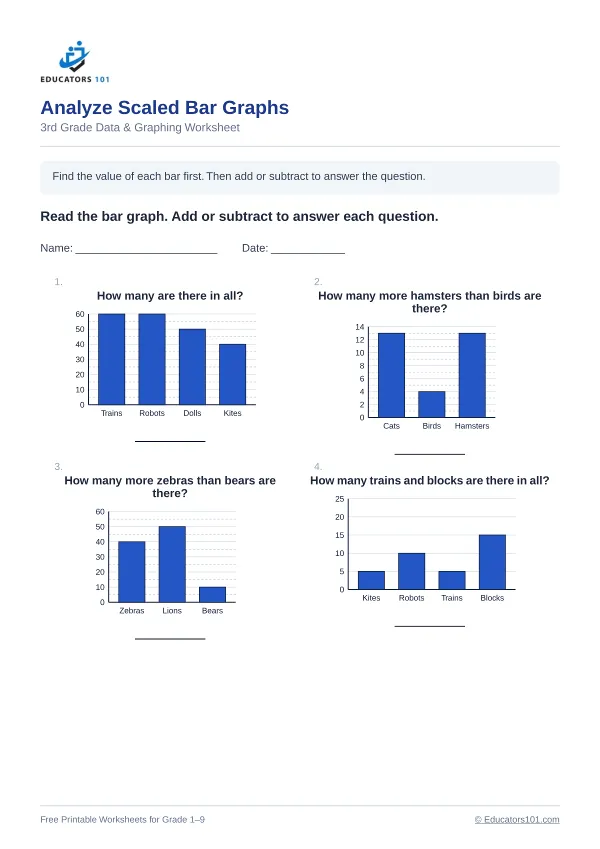 Worksheet #10
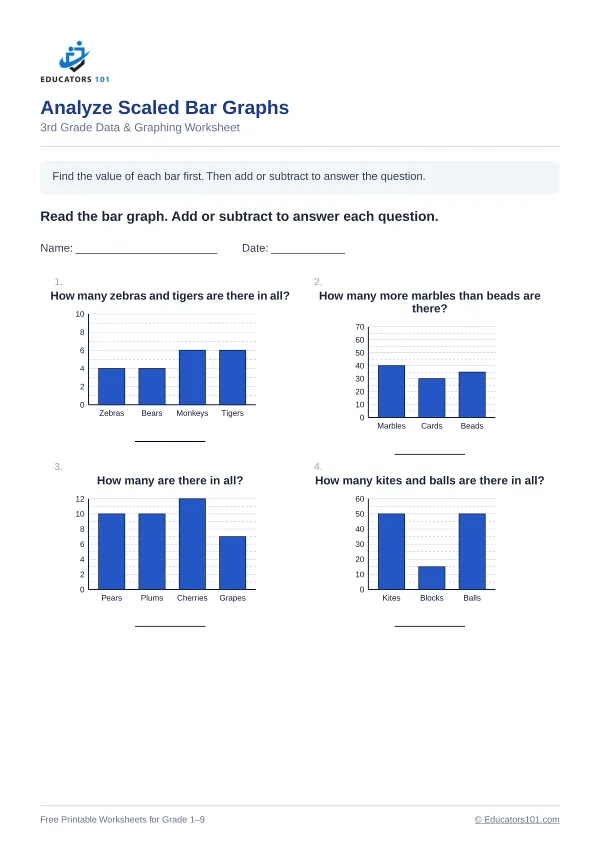 Worksheet #11
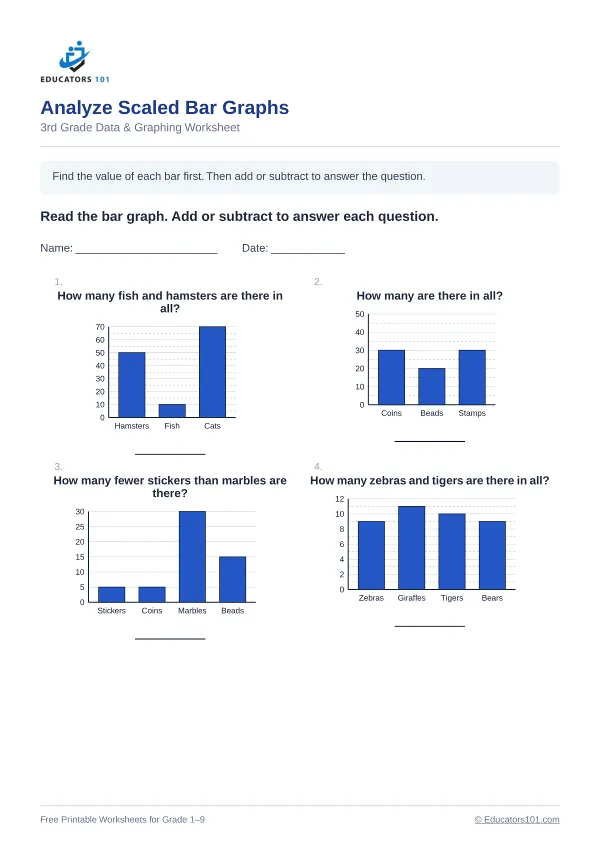 Worksheet #12
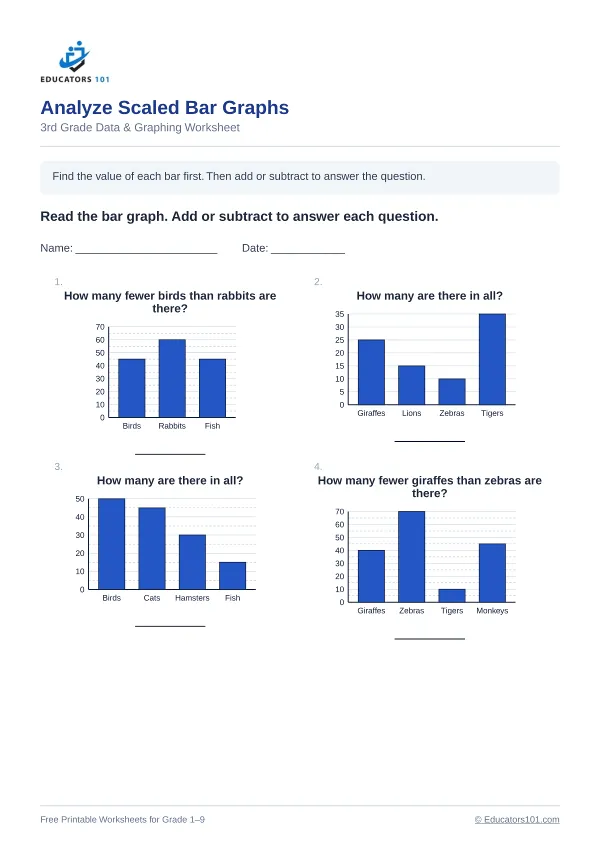 Worksheet #13
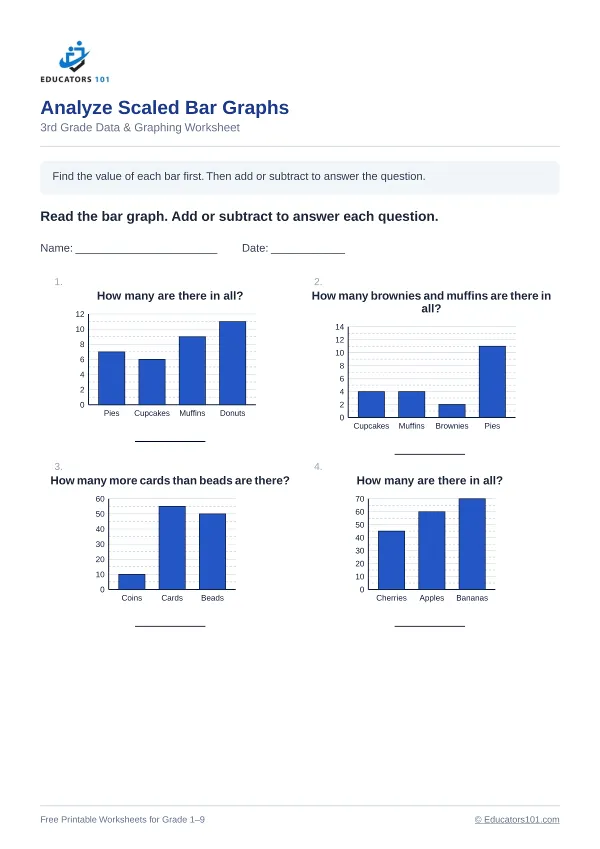 Worksheet #14
 Worksheet #15
Analyze Scaled Bar Graphs: what children learn
Once kids can read each bar, they use the values to solve one-step problems. Adding finds how many in all, and subtracting finds how many more or fewer.
Analyze Scaled Bar Graphs: worked example
On a bar graph, Cats is 30 and Dogs is 20. How many more cats than dogs are there? 10
Subtract the smaller bar from the bigger bar: 30 - 20 = 10.
Analyze Scaled Bar Graphs: a common mistake to watch for
Kids sometimes add the two bars when the question asks how many more.
Analyze Scaled Bar Graphs: how to help at home or in class
Write more, fewer and in all on three cards. Draw a bar graph, pick a card, and ask your child to write the two bar values as a short number sentence before answering. Then swap, and your child invents a question for you. When your child chooses between adding and subtracting from the question wording alone, graph drawing is next.
What is on these Analyze Scaled Bar Graphs worksheets
This set has 15 different worksheets for 3rd grade, with 4 questions on each and a matching answer key for every sheet. The instruction printed on each worksheet is: “Read the bar graph. Add or subtract to answer each question.”
Every answer on every sheet is checked by a separate program before the worksheet is published. How we check answers