
Make Scaled Bar Graphs Worksheets for 3rd Grade
Draw the bars for a graph whose scale counts by 2s, 5s or 10s. 15 free printable worksheets, each with an answer key.
Save to PinterestFree Make Scaled Bar Graphs Worksheets
Click a worksheet to open the PDF, or grab the matching answer key. Every sheet prints on one page.
 Worksheet #1
 Worksheet #2
 Worksheet #3
 Worksheet #4
 Worksheet #5
 Worksheet #6
 Worksheet #7
 Worksheet #8
 Worksheet #9
 Worksheet #10
 Worksheet #11
 Worksheet #12
 Worksheet #13
 Worksheet #14
 Worksheet #15
Make Scaled Bar Graphs: what children learn
Making a bar graph shows that kids understand the scale. They find each number on the side axis and draw the bar to that height, including the light halfway line when the scale counts by 2s or 10s.
Make Scaled Bar Graphs: worked example
Cats: 20, Dogs: 35, Birds: 10 Cats 20, Dogs 35, Birds 10
Draw the Cats bar to 20, the Dogs bar halfway between 30 and 40, and the Birds bar to 10.
Make Scaled Bar Graphs: a common mistake to watch for
Kids sometimes draw a bar one line high for each count instead of going up to the number.
Make Scaled Bar Graphs: how to help at home or in class
Use grid paper where each square stands for 5. Pick data such as 20, 35 and 10, and ask your child to choose and label the scale before drawing any bar. Ask where a bar of 35 should end: halfway between the lines for 30 and 40. When bars stop exactly on the intended heights, move on to line plots.
What is on these Make Scaled Bar Graphs worksheets
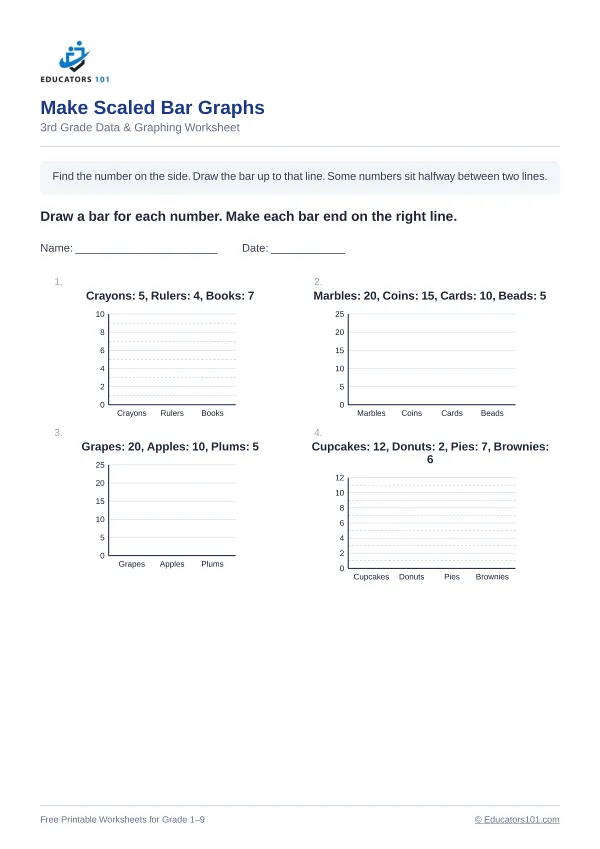
This set has 15 different worksheets for 3rd grade, with 4 questions on each and a matching answer key for every sheet. The instruction printed on each worksheet is: “Draw a bar for each number. Make each bar end on the right line.”
Every answer on every sheet is checked by a separate program before the worksheet is published. How we check answers